Fleet / Network Posture Analysis
A clear, evidenced view of how exposed your devices and network really are.
What you get to see
A walk through the report, from the headline numbers down to a single host and the printable result. The screenshots come from the real tooling, run on invented data for a fictional company.
- 01
Start with the headline figures
The dashboard answers the first question a manager asks: how exposed are we right now? It counts how many listening services can be reached from the internet, how many issues are open, how long fixes take, and which hosts are affected.
- Internet-reachable services, separated from those that only listen inside the network
- Every open high-severity finding, oldest first, across patching, exposure, certificates, backups and containers
- Median time to fix, so you can see whether the team is keeping up
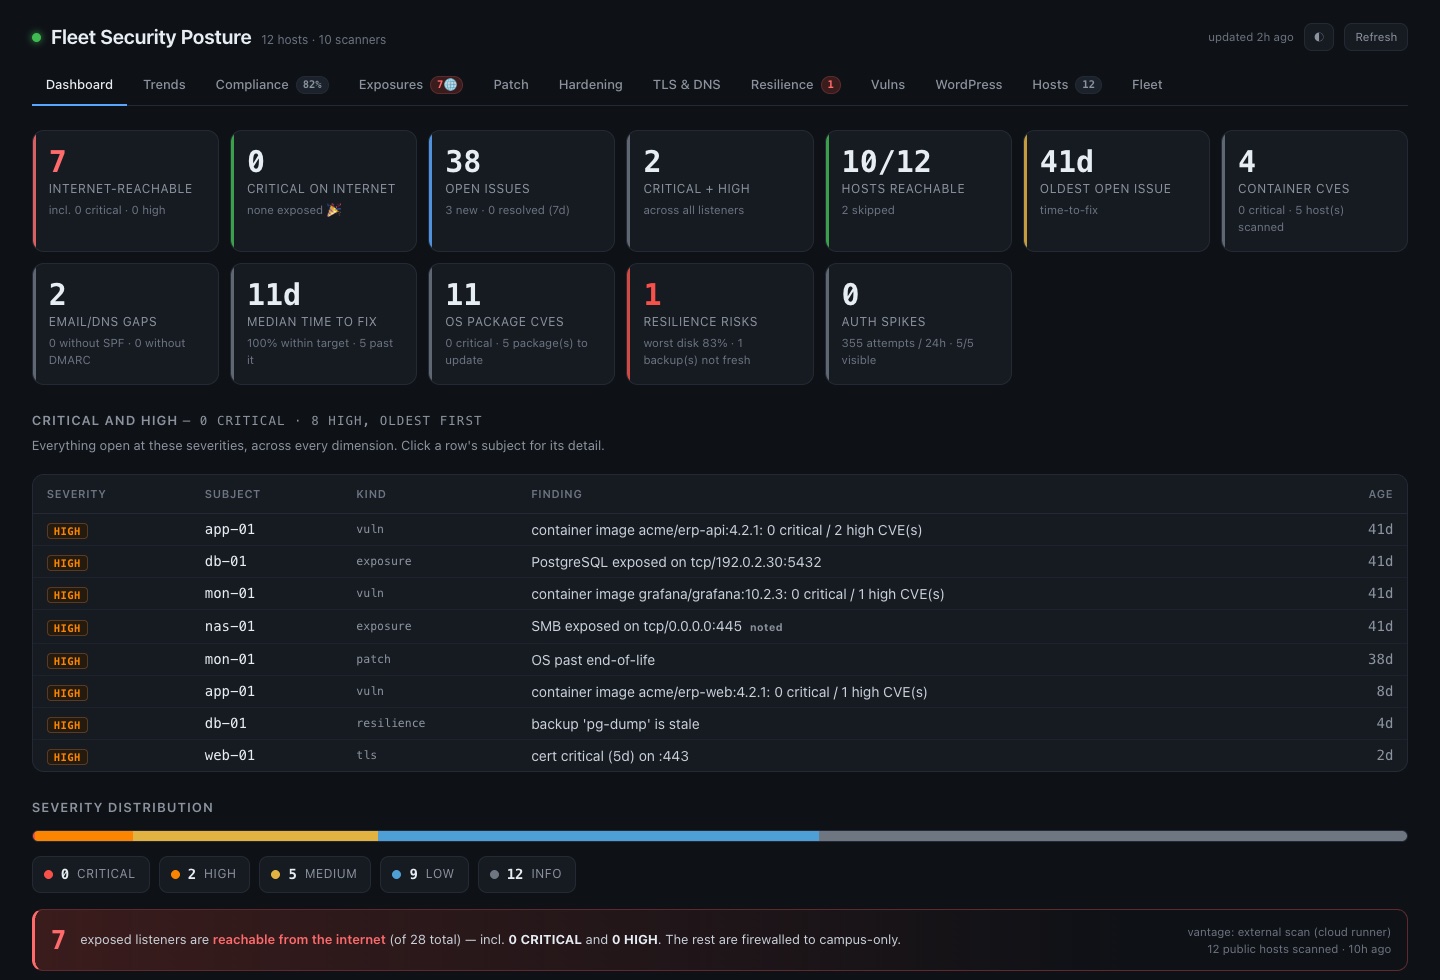
Dashboard overview: internet-reachable count, open issues, time to fix and every open high-severity finding, oldest first. Illustrative data for a fictional company. - 02
Separate what listens from what the internet can reach
A service listening on a port is not always a risk. Each flagged listener is ranked by severity and checked from outside the perimeter, so the list shows what an outsider can actually connect to, and what only looks open from the inside.
- Filter by severity and by internet or internal reachability
- See how long each exposure has been open and when it was last checked
- Track work in progress, so a known issue is not reported as new
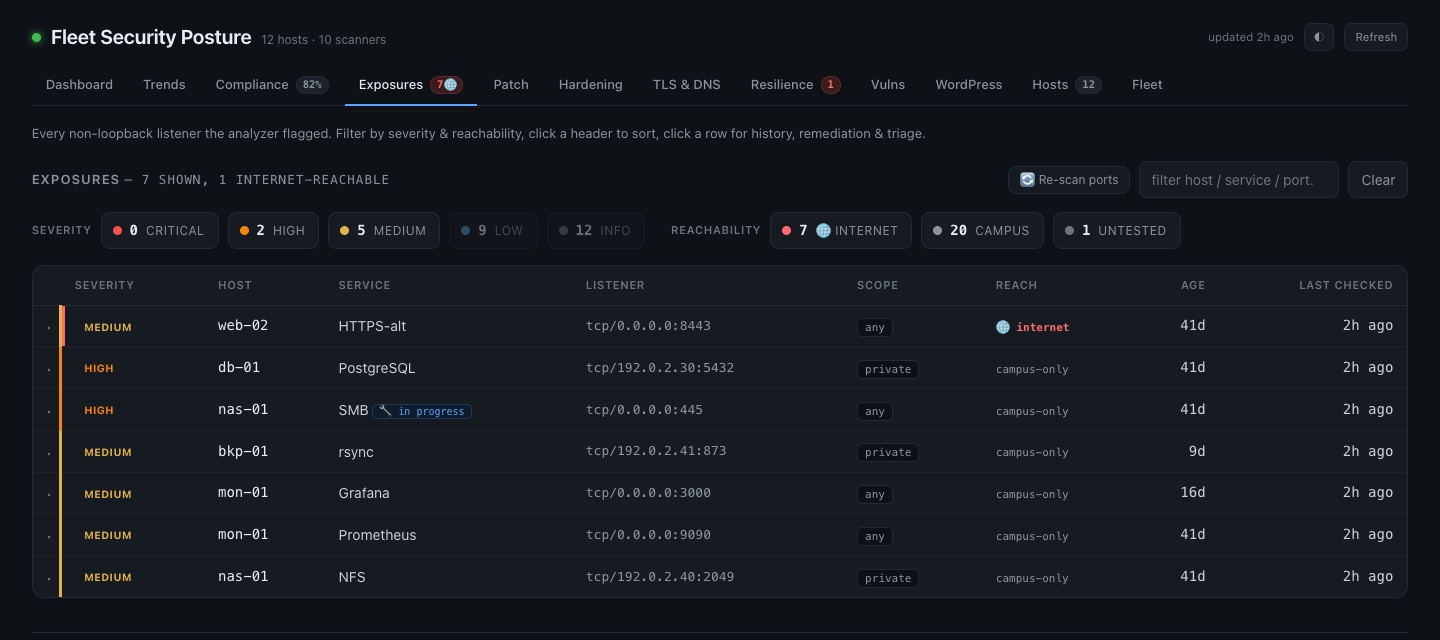
Exposures ranked by severity and checked from outside the perimeter, so a listening port is separated from one the internet can actually reach. - 03
Drill into one host
Open any host to see everything known about it in one place. This database server shows its listeners, pending security updates and whether a reboot is needed, SSH hardening, vulnerable packages that already have a fix, disk headroom and the state of its backups.
- Each check shows when it last ran
- A stale backup and a backup that has never been restore-tested are called out
- Fixes are listed with the version to move to
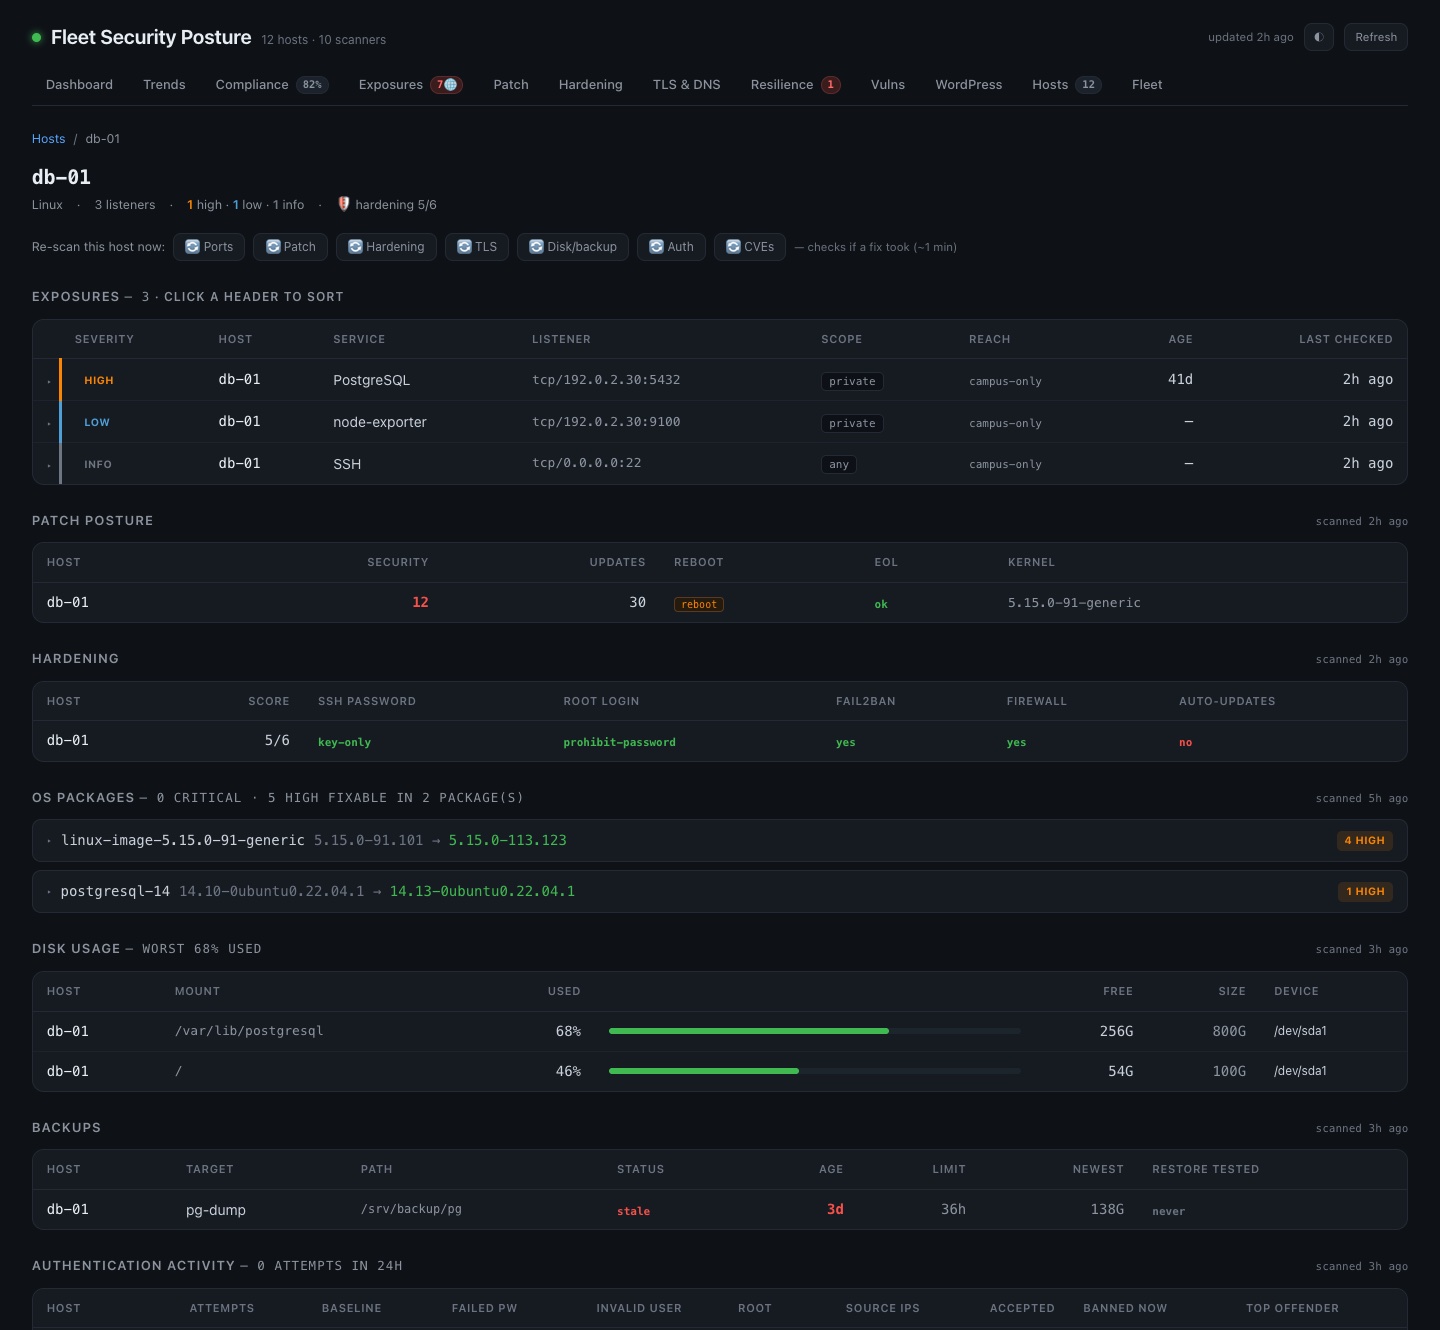
One host in full: listeners, pending patches, SSH hardening, fixable package CVEs, disk headroom and a stale backup, each with when it was last checked. - 04
Measure against a recognised baseline
The compliance scorecard maps what was observed to Cyber Essentials topics and CIS Controls v8. Nothing is self-declared: a control counts only if a check provides evidence for it, and checks without evidence lower the coverage figure instead of passing quietly.
- Score per topic, with the weight of each
- A coverage figure showing how much could be measured
- A ranked list of the fixes that raise the score the most
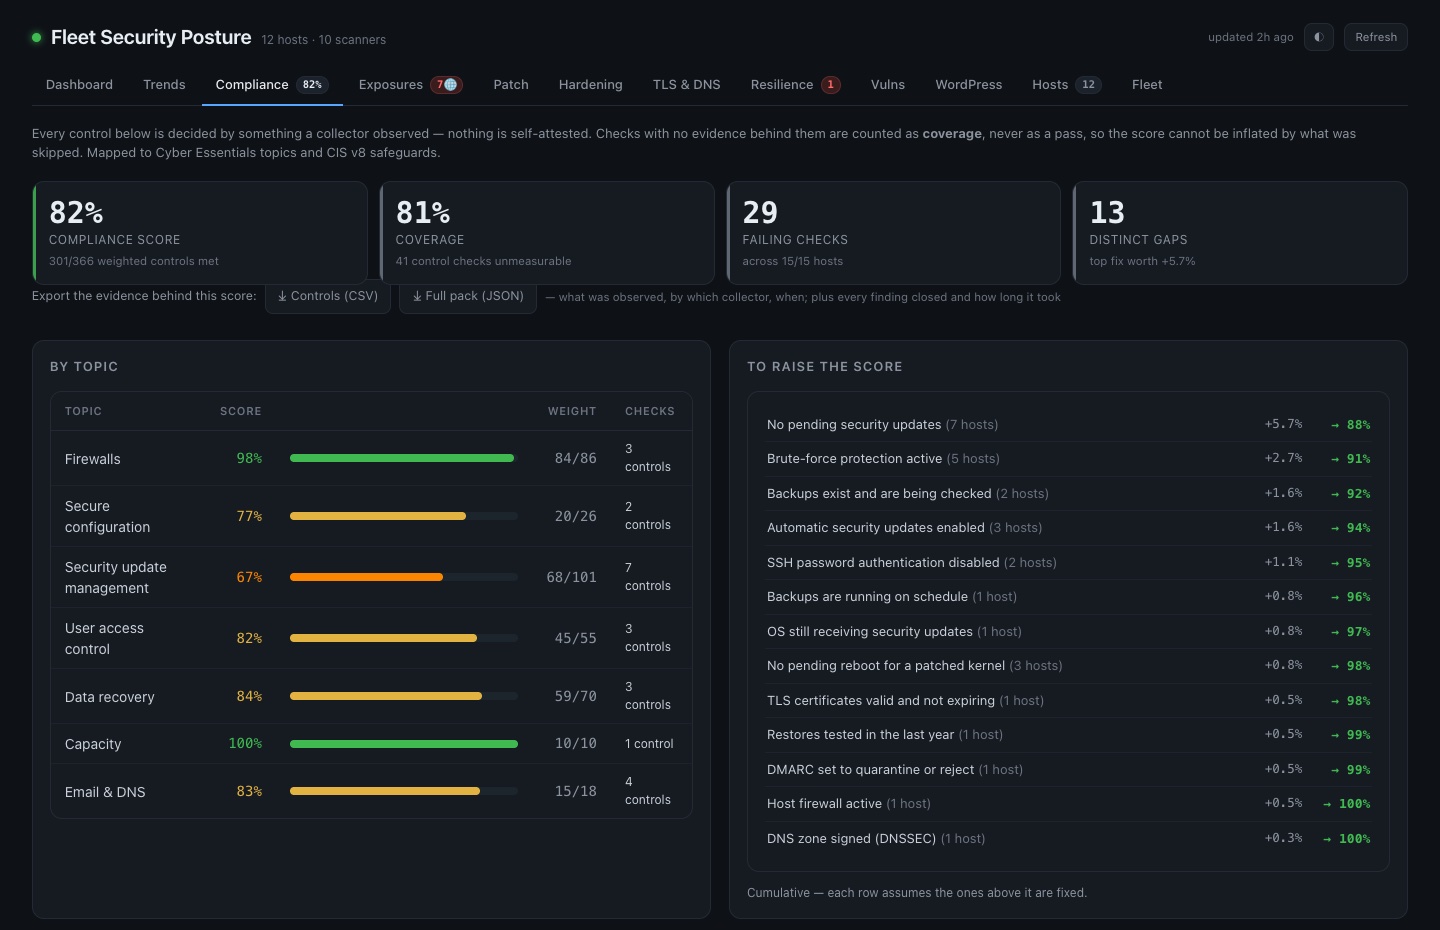
Compliance scorecard mapped to Cyber Essentials topics and CIS v8, with a coverage figure and the fixes that raise the score most. - 05
Hand over a report you can print
Findings are delivered as a printable posture report, as HTML and PDF, with the evidence behind it available as CSV and JSON. It shows what changed since the previous period, how the trends are moving, the top risks and how quickly findings are being fixed.
- What changed since the last report
- Trends for internet exposure and open issues
- Remediation performance by severity, against targets
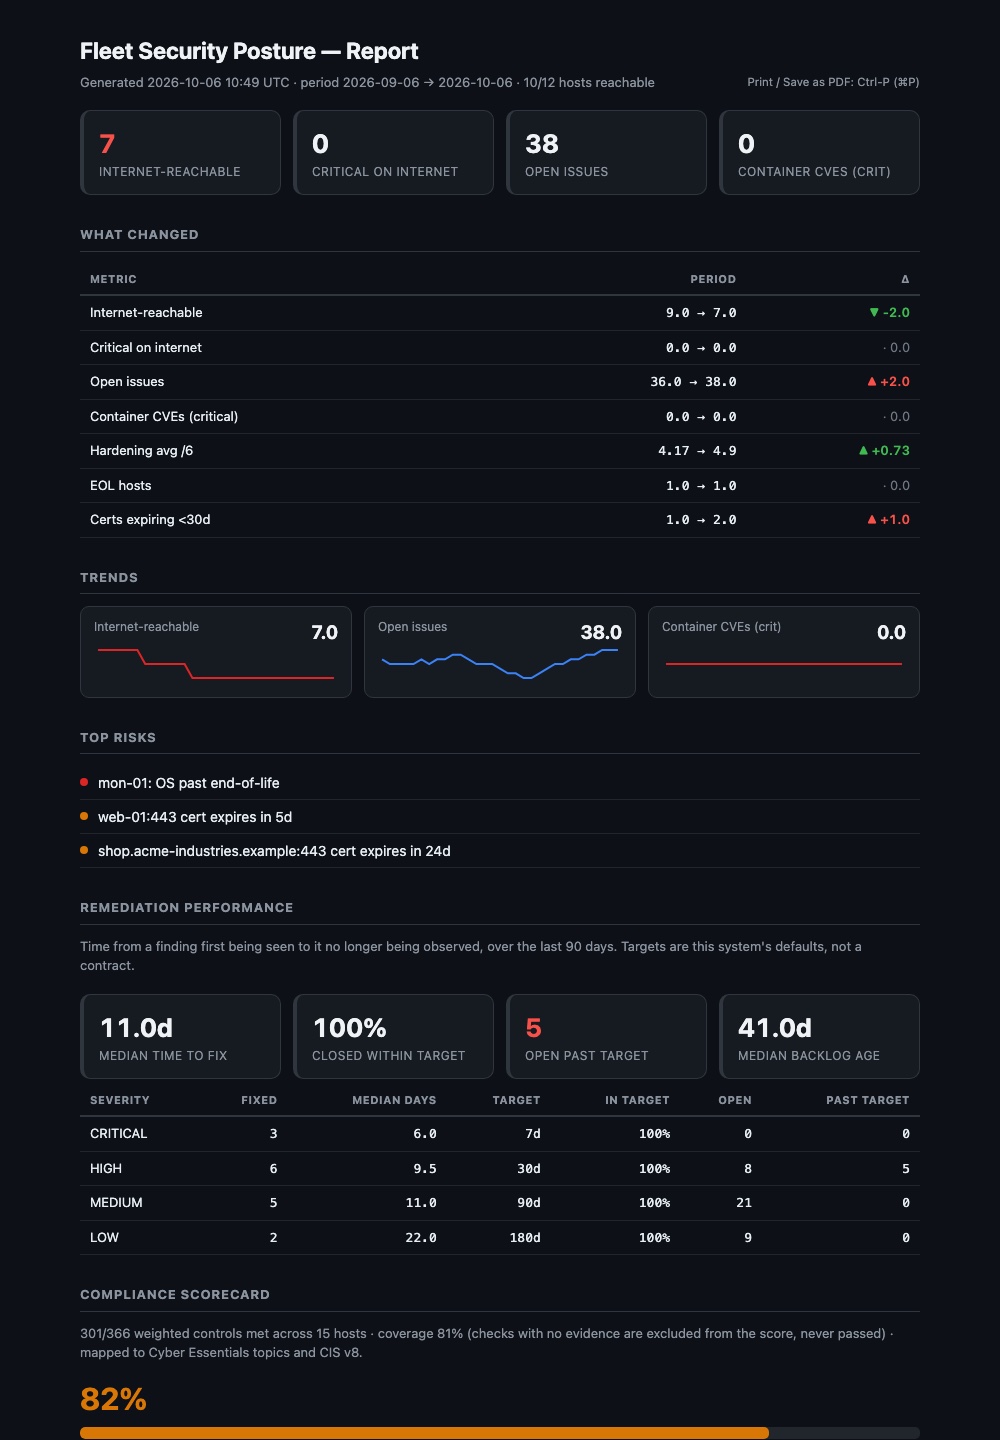
The printable posture report: what changed, trends, top risks and how quickly findings are fixed. Delivered as HTML and PDF, which print on white; shown here in dark colours to match the other screens.
What it is
Most organisations know roughly what they own, but not what is listening, what is behind on patches, or which of those weaknesses can be reached from the internet. This service answers those questions for your servers, workstations, network devices and domains, and turns the answers into a short list of things to fix, in priority order.
The assessment is built on tooling I run on my own fleet of around sixteen hosts, so the checks are ones I rely on day to day rather than a one-off audit script. Collection is read-only: a low-privilege account per host, no agent exposed to the network, and no changes made to your systems.
You receive a written report that a security manager can act on and an auditor or insurer can accept: every finding carries a severity, the observation behind it, when it was observed, and the specific fix. Where you want ongoing visibility rather than a snapshot, the same checks can be run on a schedule so drift is caught as it happens.
Features
Exposure and open ports
Every listening service is inventoried and ranked by risk, then checked from outside your perimeter to separate what is merely listening from what the internet can actually reach.
Patch and update posture
Pending security updates, kernels awaiting a reboot and end-of-life operating systems, per host, so nothing is judged by its last manual check.
Known vulnerabilities
Operating system packages, container images and WordPress core, plugins and themes are matched against published CVEs. Only issues with an available fix are reported, grouped by the one action that closes them.
Access and hardening
Effective SSH configuration, password and root login, firewall and fail2ban status, plus a Lynis hardening index per host to show drift over time.
Certificates and email security
Certificate expiry and weak TLS across every domain, and SPF, DMARC, DKIM and DNSSEC so you can tell whether someone could send mail as you.
Backups and capacity
Disk usage, backup freshness against the maximum age you declare, and how recently a restore was actually tested.
Detection signals
Failed logins, invalid-user and root attempts and fail2ban bans, judged against each host's own baseline rather than a fixed threshold.
Control mapping
Results are mapped to Cyber Essentials topics and CIS Controls v8 safeguards, with a score and a coverage figure so unmeasured checks never read as passes.
What gets checked
Servers and VMs
Linux hosts reached over SSH with a scoped, read-only account: ports, patches, hardening, authentication activity, disk and backups.
Workstations and NAS
macOS and Synology devices for open ports, operating system support status and exposed services. Some deeper checks are Linux-only today.
Network gateway
Router and gateway state, including a check for rogue IPv6 router advertisements that could redirect traffic.
Internet exposure
A scan from a vantage point outside your network, correlated against the internal findings to show what truly crosses the firewall.
Containers and applications
Container image vulnerabilities and WordPress core, plugin and theme issues, each tied to the host that runs them.
Domains, DNS and TLS
Certificates for every domain you list, and mail authentication records, scored alongside the hosts.
Cloud tenants
Azure checks such as Defender Secure Score and public exposure are planned. They are not part of the current standard scope.
What you receive
Posture report
A printable report with an executive summary, headline figures, what changed since the previous run, and the top risks in plain language. Delivered as HTML and PDF.
Prioritised findings
Each finding is rated critical, high, medium, low or informational, and states the affected host or domain, how long it has been open and what to do about it.
Evidence pack
Every control with the observation behind it, the check that made it and the time it was made, as CSV and JSON. Useful for audits and insurance questionnaires.
Remediation plan
Fixes ordered by how much risk each removes, with an indication of the score you reach as you work through them. Perimeter issues come as a short block request your network team can action directly.
Scorecard and trends
A weighted compliance score alongside its coverage figure, and a time series so improvement, or regression, can be shown rather than asserted.
How an engagement runs
Fixed-scope assessment, optionally followed by ongoing monitoring
- 01
1. Scoping
We agree what is in scope: hosts, domains and network ranges, how each is reached, and how critical it is. This becomes the asset register that drives everything else.
- 02
2. Access set-up
A low-privilege, command-restricted account is provisioned on each host, with optional narrowly scoped read grants for items such as the effective SSH configuration. Devices without a shell are read through their own APIs.
- 03
3. Collection
Read-only checks run across ports, patches, hardening, vulnerabilities, certificates, DNS and authentication activity, plus an external scan from outside your perimeter.
- 04
4. Analysis
Raw observations are ranked by severity, duplicates are collapsed to one action, and results are scored against the control set with coverage reported alongside.
- 05
5. Report and walkthrough
You receive the report, findings, evidence pack and remediation plan, and we go through the priorities together.
- 06
6. Re-scan and monitoring
After fixes, a re-scan confirms they landed. If you want continuous visibility, the checks run on a schedule, with alerts on drift and a monthly report.